A review of IP addresses, as part of my Computer Networking Fundamentals series.
A lot of people know what IP addresses are, and a lot of people also probably know that each device that is connected to the Internet must have a unique IP Address, like 108.161.228.70
However, in this article I want to do a more in-depth review about IP addresses and how the work.
From a technical point of view and for reviewing purposes, it is worth remembering that IP Addresses (at least IPv4) are 32-bit addresses, because each number separated by each dot (called octet) is an 8-bit number. Since IP Addresses have 4 octets, these together make a sum of 32-bits.
Since the first two octets make a sum of 16 bits, 2^16 yields a total of 65,536 networks. At the same time, the remaining 16 bits also yield a total of 65,536 different hosts. But these are 65,536 different hosts per each network.
This raises a big issue because it makes it hard to decide how many bits in the IP address should be allocated to the network and how many bits should be allocated for the hosts, without wasting IP addresses. This is where subnet masks come in.
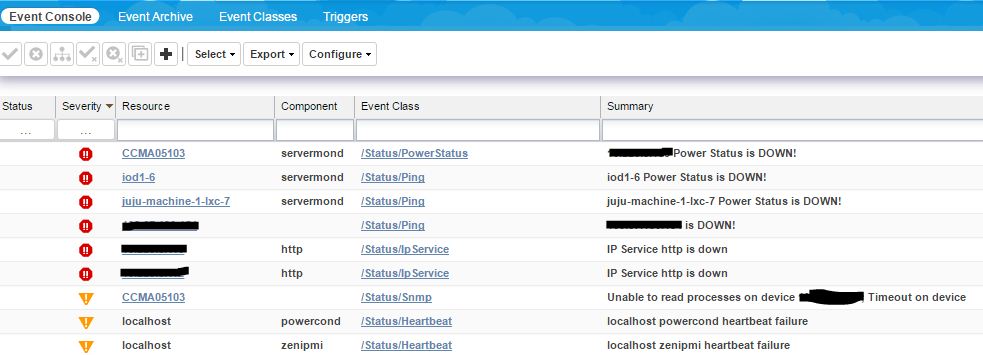
Zenoss Events are among the most powerful and useful monitoring features that Zenoss Core provides. Many different types of events are automatically generated by Zenoss when important scenarios occur for the devices being monitored.
Zenoss Event Architecture
When an event arrives at Zenoss, it is parsed, associated with an event classification and then typically (but not always), it is inserted into the status table of the events database. Events can then be viewed by users using the Event Console of the Zenoss Graphical User Interface (GUI).
The events system has the concept of active status events and historical events (two different database tables in the MySQL events database).
Understanding Event Classes
Zenoss event classes are a simple organizational structure for the different types of events that Zenoss generates and receives. This organization is useful for driving alerting and reporting. You can, for example, create an alerting rule that sends you an email or pages you when the availability of a Web site or page is affected by filtering on the /Status/Web event class^[2].
The Zenoss JSON API allows us to obtain very important information of what is going on in Zenoss, such as device information and events. This API can be queried using cURL or with some wrappers provided by Zenoss, available in languages such as Bashscript, Python, and Java.
The API documentation can be downloaded here. In the documentation you can see the available endpoints and methods that can be used to obtain the data we need.
In this post I will cover how the Zenoss back-end JSON API works, and how the Zenoss's front-end (made using ExtJS) interacts with it.
~> Even though Zenoss calls its API a JSON API (Simply because it returns data in JSON format), the API is notJSON API specification compliant.
Querying the API
To see the API in action, we can begin by making a simple query using cURL. Let's say we want to obtain all the available information of a specific device:
The above request will return the information of the device in JSON format, assuming that we replace $ZENOSS_HOST with the IP address of our Zenoss server, and $DEVICE_IP with the IP address of the device we want to query.
This is all fine if all we need is querying the API and nothing else. But what if we really want to know how the API back-end works? How the endpoints are created? What are routers?
rrdtool is an awesome high performance data logging and graphing tool for time series data. Zenoss Core uses RRDTool to collect, monitor, and graph peformance data for devices.
However Zenoss Core comes with built-in helper wrappers around RRDTool that makes using it within Zenoss much easier. These source code files can be found in $ZENHOME/Products/ZenRRD/.
RRDUtil
Located in $ZENHOME/Products/ZenRRD/RRDUtil.py, this Python module contains many wrapper methods around the rrdtool library. These methods can help us write to, create new, and read .rrd files using Python.
We can easily import this module into our code, using the following import statement:
An Intelligent Platform Management Interface (IPMI) is a set of interfaces that allow system administrators to manage and monitor systems, independently of the system's CPU, BIOS, and operating system.
IPMI can also help manage computers that are unresponsive or powered off, by using a network connection to the hardware, rather than to a operating system or login shell.
More specifically, IPMI can help us monitor, obtain data, and perform tasks such as:
System temperature
Voltages
Fans
Power supplies
Chassis intrusion
Perform recovery procedures
System rebooting
System powering
An IPMI sub-system consists of a main controller, called the baseboard management controller (BMC) and other management controllers distributed among different system modules that are referred to as satellite controllers. The satellite controllers within the same chassis connect to the BMC via another system interface (not covered in this post) called Intelligent Platform Management Bus/Bridge (IPMB)