The Zenoss Core ExtJS graphic user interface is divided into many different components. In this post I will go over on how we can modify the device detail bar to display additional custom information for devices, by creating a custom ZenPack.
Zenoss Core 4 uses ExtJS 4 JavaScript framework to manage all the user interface components. These components can be found in $ZENHOME/Products/ZenUI3/browser/resources/js/zenoss, and as you would expect, the device detail bar component is also located there.
The Device Detail Bar
This is the detail bar located on the device view page which shows the device's icon, name, events, status, production state, and priority. The JavaScript source code for this component can be found in DeviceDetailBar.js
However since we are going to extend this component through a ZenPack, we will not modify that source. Instead, we will add new code to use ExtJS to add our custom data displays.
Extending The Component, Through ZenPacks
Let's assume we are starting with a freshly created ZenPack, which adds a new power_status integer field to certain devices, according to its zenpack.yaml file:
ZenPacks are powerful custom add-ons that can help us extend Zenoss's functionality. In this post I will go over on how to create a ZenPack that adds a custom daemon to the existing Zenoss daemons and runs on a configured cycle time to perform custom tasks. We will achieve this by creating the ZenPack using zenpacklib, but it is also possible to create it from the Zenoss user interface.
About zenpacklib
zenpacklib is a Python library developed by the Zenoss team to facilitate the process of creating ZenPacks, specially ZenPacks that deal with modeling and monitoring devices and components. Most of the newer ZenPacks that are being released are now being built with zenpacklib.
We can obtain zenpacklib by running the following commands:
Once the ZenPack is installed, files under this daemons directory will become executable (chmod 0755), a symlink to the file will be created in $ZENHOME/bin, and a configuration file will be generated in $ZENHOME/etc/<daemon_name>.conf
NOTE: If you created your ZenPack using the Zenoss user interface, the daemons directory will also be automatically created, and will contain an example daemon file named zenexample with code similar to the one above. In this case you should simply replace the necessary values.
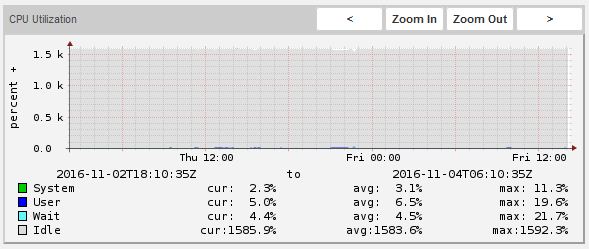
While taking a look at the CPU Utilization graphs offered Zenoss Core's Linux Monitor ZenPack (v1.2.1), I noticed that the percentage values for Idle were ridiculously high:
This made sense since this particular device contains 16 cores. However, this then means that the monitoring template isn't really taking this into consideration, and instead just spits out the total value from all cores.
Content from this post is mostly obtained from Zenoss Core Administration guide.
In Zenoss Core monitoring templates, data sources can return data for one or more performance metrics. Each metric retrieved by a data source is represented
by a data point.
When creating a data point, there are some important fields that we can define for our data point:
Name: Displays the name you entered in the Add a New DataPoint dialog.
RRD Type: Specify the RRD data source type to use for storing data for this data point. (Zenoss Core uses RRDTool to store performance data.) Available options are:
COUNTER: Saves the rate of change of the value over a step period. This assumes that the value is always
increasing (the difference between the current and the previous value is greater than 0). Traffic counters on a
router are an ideal candidate for using COUNTER.
GAUGE: Does not save the rate of change, but saves the actual value. There are no divisions or calculations.
To see memory consumption in a server, for example, you might want to select this value.
DERIVE: Same as COUNTER, but additionally allows negative values. If you want to see the rate of change
in free disk space on your server, for example, then you might want to select this value.
ABSOLUTE: Saves the rate of change, but assumes that the previous value is set to 0. The difference between
the current and the previous value is always equal to the current value. Thus, ABSOLUTE stores the current
value, divided by the step interval.
Create Command: Enter an RRD expression used to create the database for this data point. If you do not enter
a value, then the system uses a default applicable to most situations. For details about the rrdcreate command, go here.
RRD Minimum: Enter a value. Any value received that is less than this number is ignored.
RRD Maximum: Enter a value. Any value received that is greater than this number is ignored.
Data Point Aliases
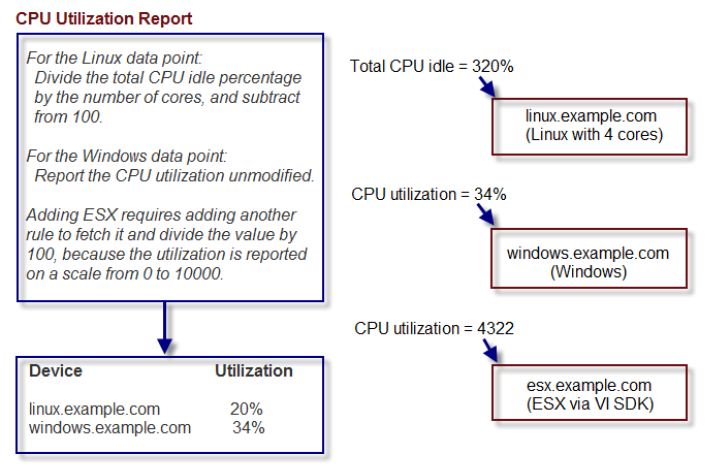
Performance reports pull information from various data points that represent a metric. The report itself knows which
data points it requires, and which modifications are needed, if any, to put the data in its proper units and format.
The addition of a data point requires changing the report.
To allow for more flexibility in changes, some reports use data point aliases. Data point aliases group data points so
they can be more easily used for reporting. In addition, if the data points return data in different units, then the plugin
can normalize that data into a common unit.
In Zenoss Core 4, we can configure some email notifications that produce and send emails based on conditions defined in a trigger, when an event is created.
Additionally, Zenoss Core 4 also provides command type notifications that allow us to execute commands in the Zenoss machine when the trigger criterias are met.
For example, let's say we want to execute a script everytime we ping a device and get no response. This scenario would involve the following:
The device is suddenly down.
Zenoss pings the device and gets no response.
The device status is then changed to DOWN.
An Event with an event class of /Status/Ping and a severity of Critical is created.
With this information, we can create a trigger that will represent this exact scenario. Moreover, we can configure a command notification to be executed when this trigger is fired.
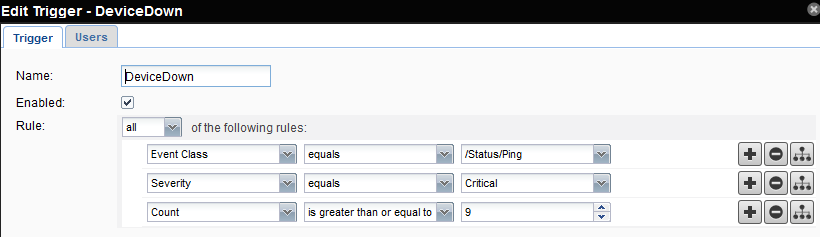
Configuring a Trigger
Navigate to Events > Triggers
Create a new trigger.
Add the rules that represent the scenario mentioned before. In this case, all of these rules must apply:
=> Because we want to make sure the device is truly DOWN, and has been so for quite a while, we also want to add a condition that checks that the event count is greater than a certain number, only then the trigger will be fired, and consequently, the command.